Introduction
As a technology professional, you will come across modeling diagrams in many situations -- whether you are creating, reviewing or presenting them. It is crucial to be able to understand the different types of diagrams, who in your team should create them, and what the different use cases are for each one.
I can't stress enough the importance of speaking the lingo with your team and stakeholders. In fact, that's the purpose of this post: a high-level overview of the different types of UML diagrams that empowers you to talk the tech language.
What is UML?
UML is a set of standardized (Unified) diagrams, just like construction has front elevation, electrical diagram, floor plan, etc., UML offers different views of the same system.
Why do we model? Well, developing a model for a software system prior to its development is as essential as having a blueprint for a large building construction, where it promotes better understanding of the requirements. Modeling is a very effective way for communication with stakeholders (customers, domain experts, designers, developers, etc.) and understanding the problem.
A picture is worth a thousand words.It allows the team to design and plan the system they are building before wasting any time coding the wrong design. Because in the long run, applications that are well planned and built with solid design are actually less time consuming to build, more flexible and easier to maintain than systems built by trial and error.
How do we model? To answer this question we need to know the following:
- What are the different UML diagrams?
- Which team member is responsible of creating each diagram?
- What is each diagram used for?
1. Class Diagram
What is a Class? A class is a description of a group of objects with common properties (attributes like location, time), common behavior (operations), common relationships to other objects, and common semantics.
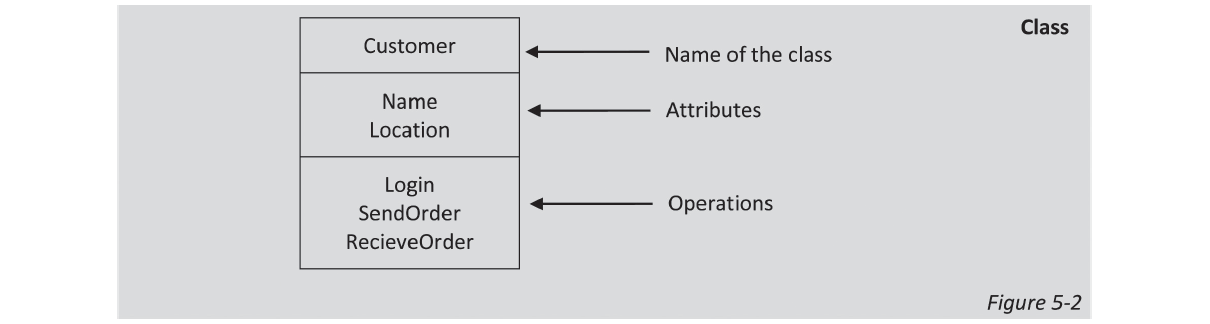 Image from the
"3D Business Analyst" book.
Image from the
"3D Business Analyst" book.
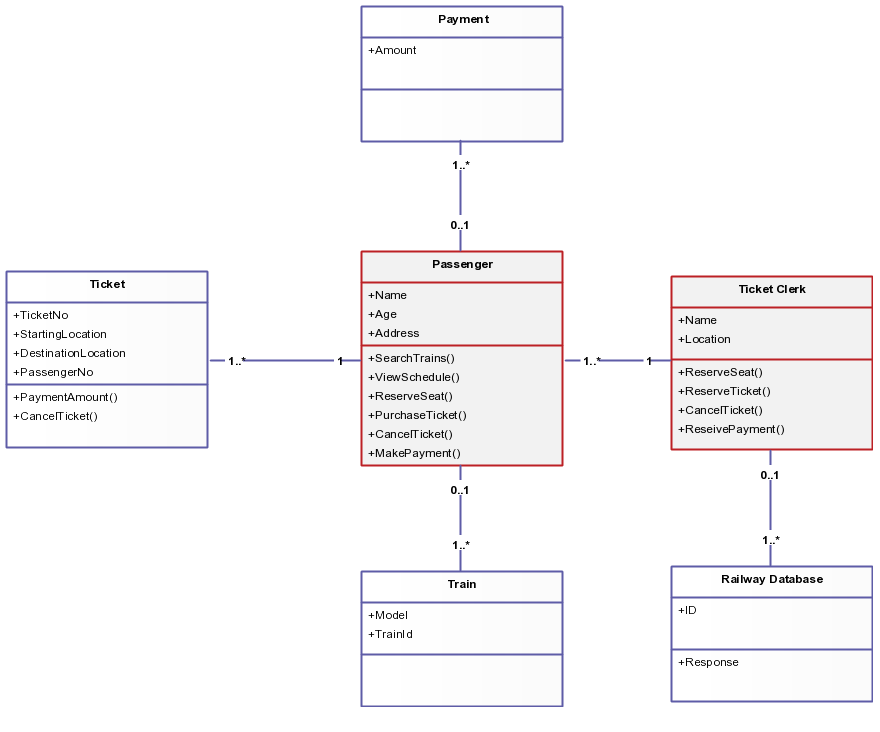
Class diagram describes the structure of a system by showing the system’s classes, their attributes
and the relationships among these classes. It explains the application graphically in a technical
way where a common user cannot understand by looking at it.
It is a static structure: which means they display what interacts but not what happens when they
interact.
Class diagrams are created by the Architect or the Technical Lead (TL).
2. Component Diagram
What is a Component? A component is a physical and replaceable module of an application that
conforms to and provides the realization of a set of interfaces. Components are composed of
one or more classes or interfaces.
Graphically, a component is represented as a rectangle with tabs, usually including only its name.

Since the system is created of several components, not one piece, a component diagram is used
to depict how the various components of a system and show the dependencies among these
components.
Component Diagrams are used during the technical design and created by the Architect or the
Technical Lead (TL).
3. Deployment Diagram
Deployment diagrams show the physical relationship among software and hardware components
in the system. They show how the component diagrams interact. In many cases developers
combine the component and deployment diagrams into a single diagram.
Deployment diagrams are created by the Architect or the Technical Lead (TL).
4. Package Diagram (Decomposition)
Package Diagrams are similar to Class Diagrams. However, instead of showing the individual
classes, they show the related classes grouped together into a unit called a “Package”. When the team deploys
software it should always be packaged: related functionalities can be packaged together and then
packaged with the overall application.
A dependency exists between two packages if any dependency exists between any two classes
inside each package. Package Diagrams can be really useful to obtain an overview of a large
system. Sometimes developers also choose to display the individual classes inside the packages.
Deployment diagrams are created by the Architect or the Deployment Specialist.
5. Statechart Diagram (State Machine Diagram)
What is a state? A state is a condition during the life of an object. It satisfies some condition,
performs some action, or waits for an event.
The UML notation for a state is a rectangle with rounded corners as shown the figure below.

State diagram describes the behavior of a system where it shows all the possible states an object
can get into. Mostly, State Diagrams are drawn to show the lifetime behavior of a single class. The
large black dots indicate the starting and ending points of the events. State transition diagrams
are drawn for objects that typically have a lot of dynamic behavior.
Statechart diagrams are created by the Architect.
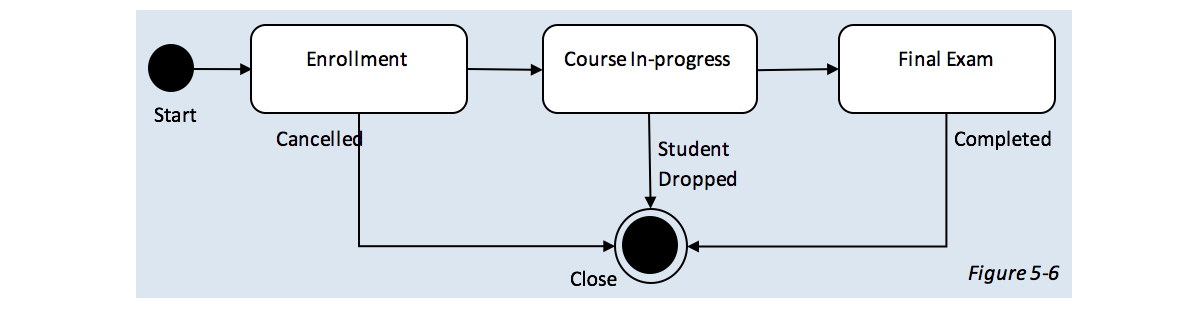 Image from the
"3D Business Analyst" book.
Image from the
"3D Business Analyst" book.
6. Object Diagram
An object is an instance of a class. The object diagram is a static snapshot of a dynamic view that depicts a complete or partial view of the system at a specific time. Object diagrams are created by the Architect or the Developer.
- Technically, BAs don't create the 6 types of diagrams mentioned above, but in rare situations you might be asked to create any of them.
- As a BA you will be responsible for creating Sequence Diagrams, Activity Diagrams, Swim lane Diagrams and Use Cases.
7. Sequence Diagram
It is designed to show the users, stakeholders and technical team how the processing of messages
will happen in a time oriented manner, where it displays the sequence of events between entities
of the system to show the dynamic view of the system.
Sequence diagrams are executed line by line showing the time ordering of messages. Let’s take
a look at the following example:
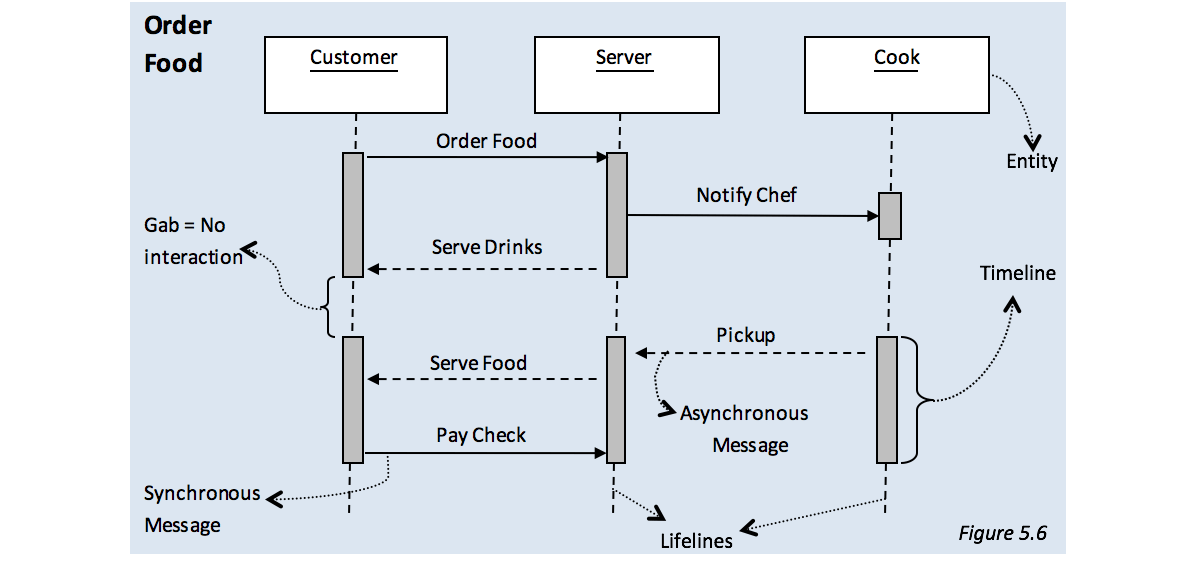 Image from the
"3D Business Analyst" book.
Image from the
"3D Business Analyst" book.
The diagram shows the different processes as vertical columns or lines, and the messages or
interactions between them are represented by arrows with the arrowhead pointing towards the
receiver – away from the sender. The name of the message is written above the message arrow
line.
In this example, there are three entities – Customer, Server and Cook. The flow of messages can
be read as follows:
- The customer orders food from the server
- Server will notify the cook to prepare the food and serve the drinks
- Waiter will pick up the ready food from the cook and serve it to the customer
- Customer will pay the check to the waiter
The message sent between two entities can be synchronous or asynchronous:
- Synchronous message indicates that the sender will wait until the receiver has finished
processing the message and only then proceed (represented by a solid-line arrow).
In figure 5.6, “place order” is synchronous message because the customer (sender) orders food and waits for the server’s (receiver) confirmation. - Asynchronous message indicates that the sender will not wait for a response that the
receiver has received and finished processing the message (represented by a hashedline
arrow)
In figure 5.6, “serve food” is asynchronous message because the server (sender) does not need to wait for the customer (receiver) to respond. Server will just serve the food or drinks and leave.
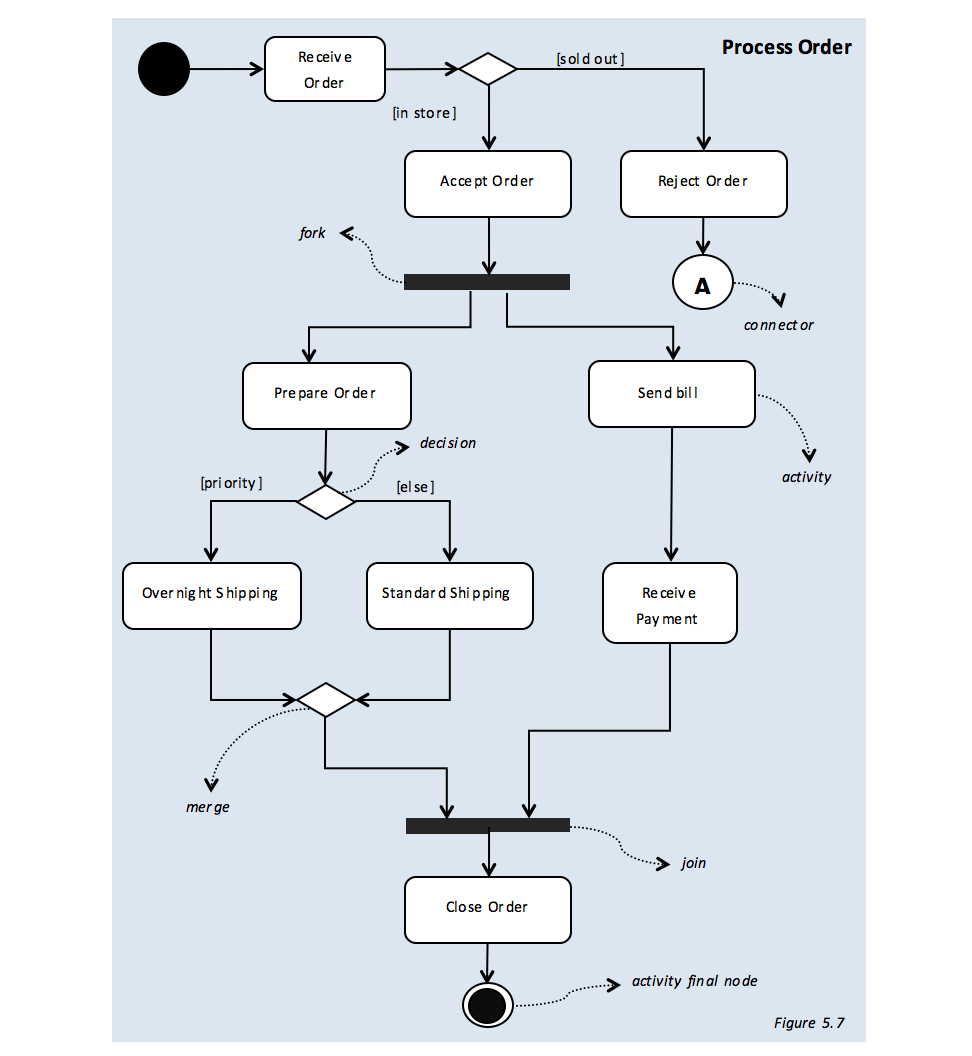
8. Activity Diagrams
Activity diagrams are similar to flow charts. They describe the sequencing of activities, actions,
choices and system’s logic. Like Statechart diagrams, the starting point is indicated with a large
black dot. The horizontal black lines indicate where the object may take one of several different
paths of action. Activity Diagrams are especially useful for objects which contain a lot of complex
logic that you wish to clearly present.
Activity diagrams are typically used for business process modeling. They tell the story of the
business process in a diagrammatic representation.
Symbols used in activity diagrams:
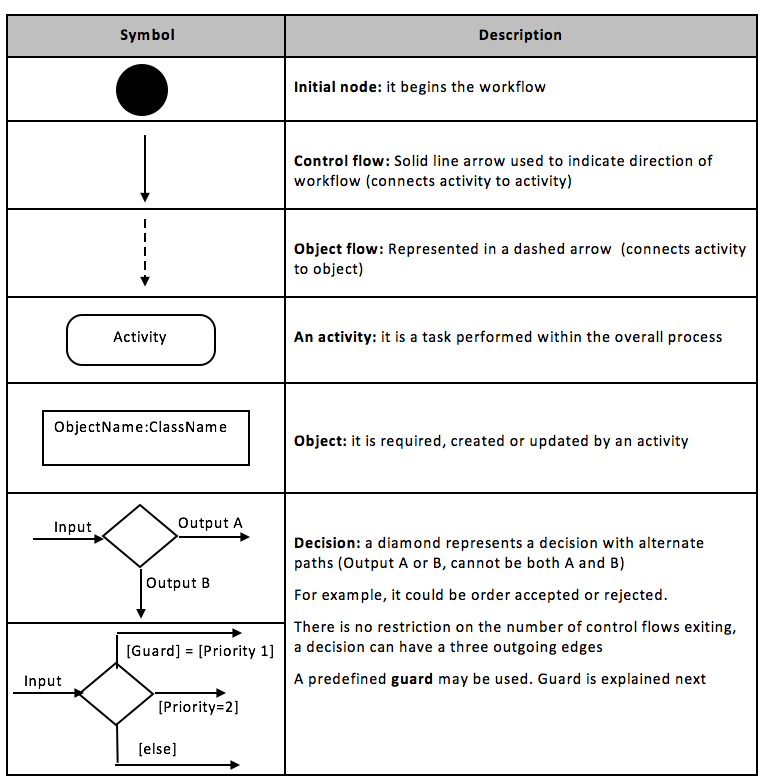 Image from the
"3D Business Analyst" book.
Image from the
"3D Business Analyst" book.
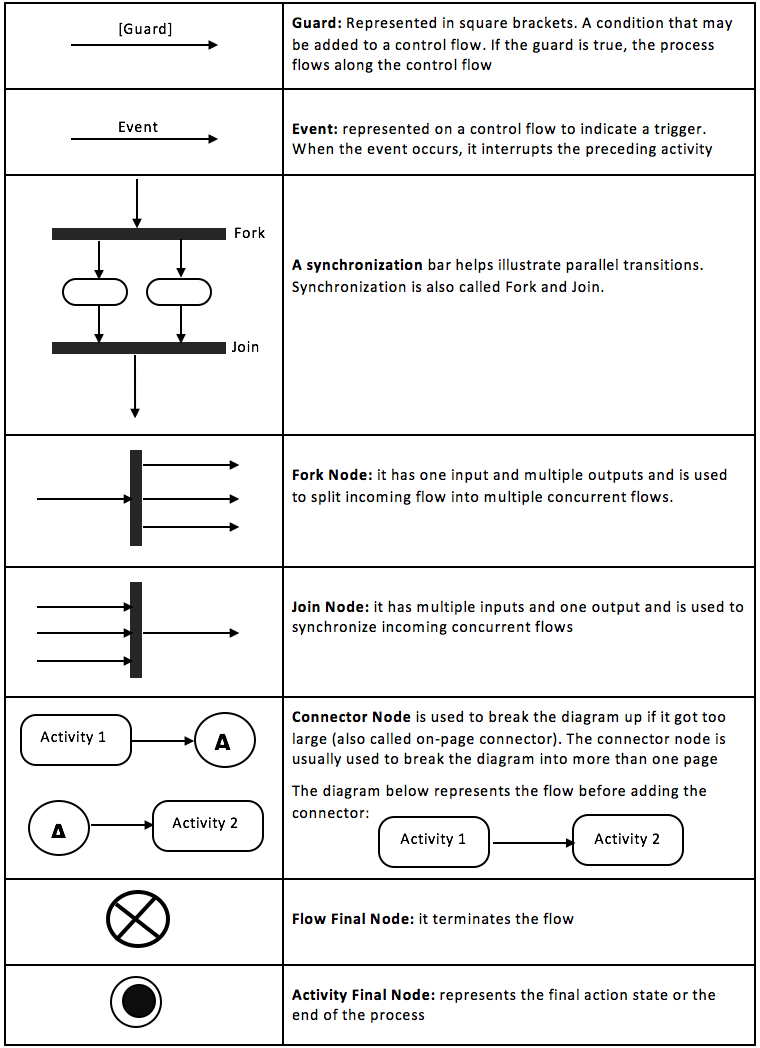 Image from the
"3D Business Analyst" book.
Image from the
"3D Business Analyst" book.
 Images from the
"3D Business Analyst" book.
Images from the
"3D Business Analyst" book.
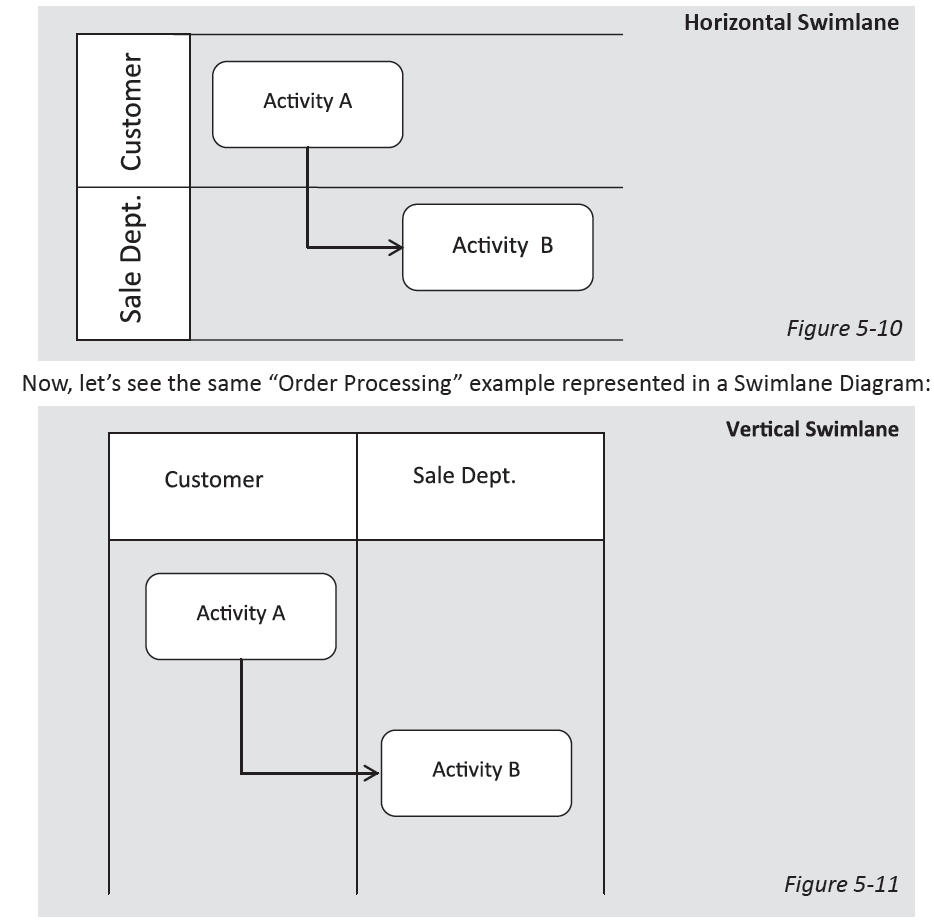
8.1 Swimelane Diagrams
Activity Diagram can be represented using a partition notation, called Swimlane Diagram or Cross-functional Diagram. A partition may represent a specific role or a location at which the behavior takes place.
 Images from the
"3D Business Analyst" book.
Images from the
"3D Business Analyst" book.
9. Use Case Diagrams
Read Use Case Diagram Part 1 and Part 2.