Introduction
Six sigma is a highly structured process that focuses on developing and delivering products and services with zero errors (near-perfect).
“Six sigma has forever changed GE (General Electric). Everyone is a true believer in Six Sigma, the way this company works now”. (John F. Welch, Former GE Chairman)
This series consists of 3 articles, organized as follows:
- Part 1: The Lean Process (Eliminate Waste)
- Part 2: Six Sigma (Eliminate Variation)
- Part 3: Lean Six Sigma Challenge (Win a free copy of the 3D Business Analyst book)
What is Sigma (σ)? And why “six” sigma (6σ)? top
Sigma is a statistical term that represents the standard deviation of a process about its mean. Standard deviation is used to measure how widely spread the data values are compared to the mean. If standard deviation (σ) is zero, this means that all data values are equal and there is no error (no variation) in the process. This is the ideal case.
Sigma (σ) is a measure of variation for process performance It provides information about the amount of variation in a process
In normally distributed process:
- A 1σ process has a yield (productivity) of = 68% and defect or error rate = 32%
- 3σ = 99.73% yield, defect = 0.027%
- 4σ = 9939968%
- 6σ = 99.9999998% yield!!!
You might ask why we need to go all the way to 6σ when 3σ provides us a yield of 99.73%? Well,
let’s see how good a 3σ (99.73%) process is?
A process that provides 99.73% certainty would result in:
- 21,000 incorrect drug prescriptions annually
- 110 mistaken medical procedures daily
- More than 2 million documents lost by IRS annually
- 18,000 pieces of mishandled mail per hour
- 33 plane accidents per million flights
Let’s see the defects rate per million opportunities (DPMO) for each σ process: (The failure rate can also be referred to as Defects Per Opportunity (DPO)
| Sigma Level | DPMO |
| 6σ | 3.4 |
| 5σ | 233 |
| 4σ | 6,210 |
| 3σ | 66,810 |
| 2σ | 305,538 |
| 1σ | 691,462 |
You apply the sigma level that is appropriate to your process. Of course 6σ is the safest choice, but has a huge cost impact to move from one sigma level to a higher one. An average company applies 3σ process.
The 5 steps of the six sigma process are described as DMAIC.
DMAIC top
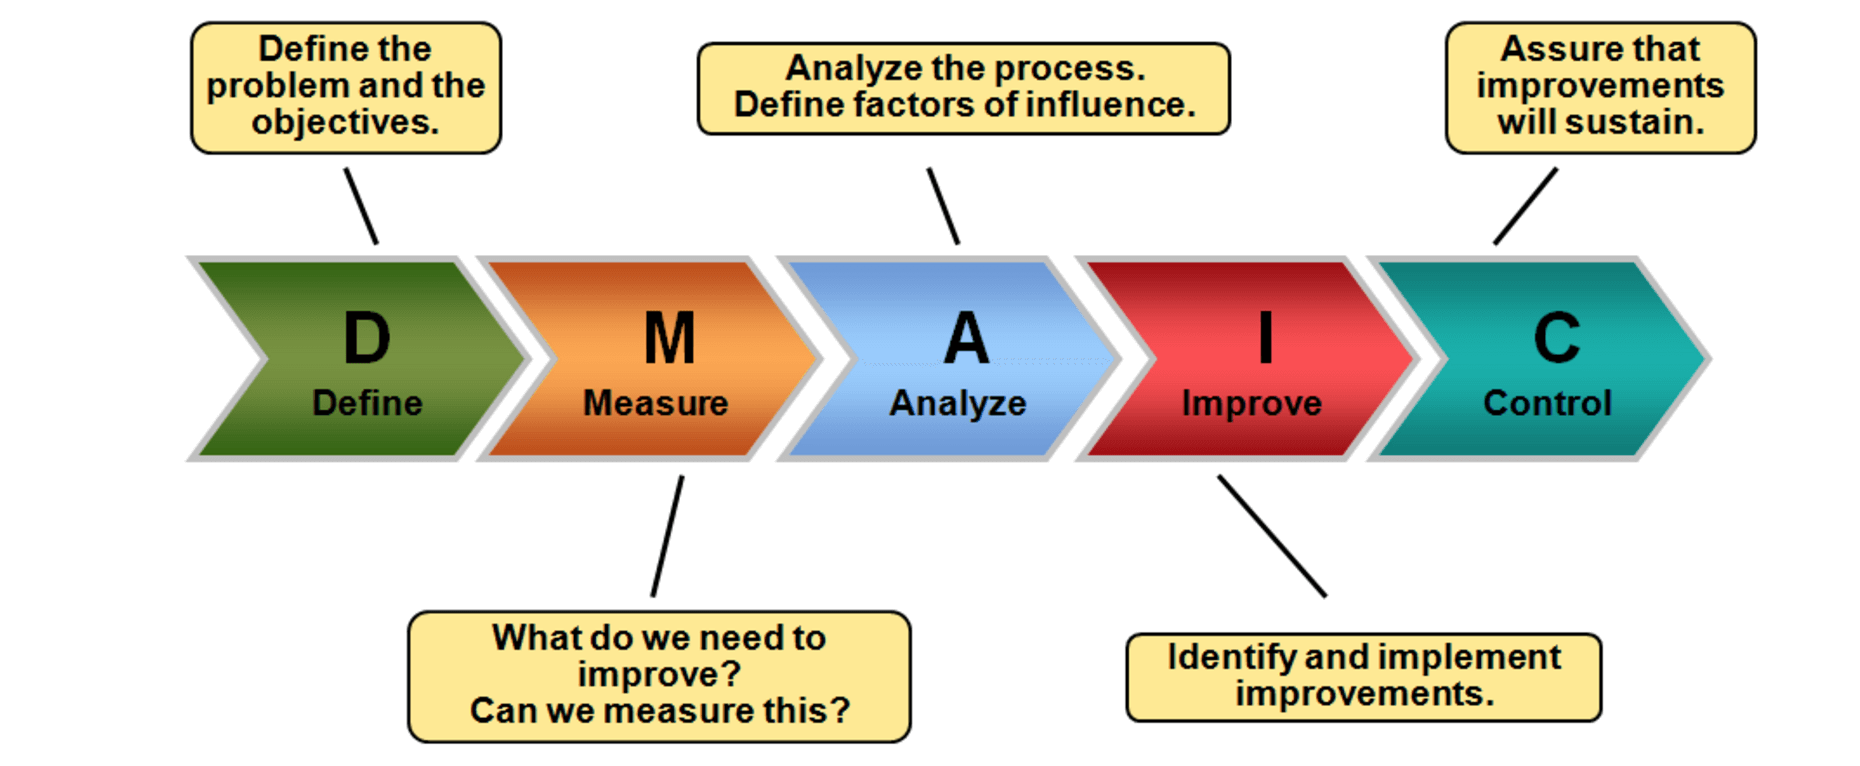
DMAIC is a structured problem-solving framework widely used in six sigma process. It consists of five phases: Define, Measure, Analyze, Improve, and Control.
DMAIC is pronounced as “Duh-MAY-ick” DMAIC framework supports creative thinking within the system boundaries, i.e., keeps basic processes, products or services. It does not start a new system from scratch
3.1. Define (customer & goals to understand problem) top
Process Improvement projects start with a need or a goal to be achieved. In the define phase, team members get introduced to the project, their roles and what they are trying to achieve.
The define phase in DMAIC is very similar in concept to the initiation phase in project management.Tools and tasks performed in define stage:
- Define the project goals - why are you doing the project?
- Create the project charter - what is the problem, goals, scope, schedule, impact, and team?
- Develop the team and launch the project
- Define the customer
- Define value from customer’s perspective, “Voice Of Customer” (Lean & Six Sigma integration)
- Develop SIPOC Diagram
It is a process used to describe the process Supplier – Input – Process – Output – Customer. SIPOC allows the team of identify the project scope and agree on its boundaries. It is also a great tool to verify that the process inputs match outputs of the preceding (upstream) process and inputs/expectations of the successive (downstream) process.
- Supplier: could be internal or external supplier to the process
- Inputs: could be material, documents, information, requirements, etc
- Process: a block representing the entire process to produce the output
- Outputs: deliverables or work products
- Customer: could be internal or external customers depends on the process scope
Note that the customer does not necessarily have to be the end user or an outsider. The customer is any person or organization that directly receives an output from work activity. Let’s create a SIPOC diagram for the “requirement elicitation process” example: (this is actually very useful for you as a PM or BA to identify your customers and know their expectations)
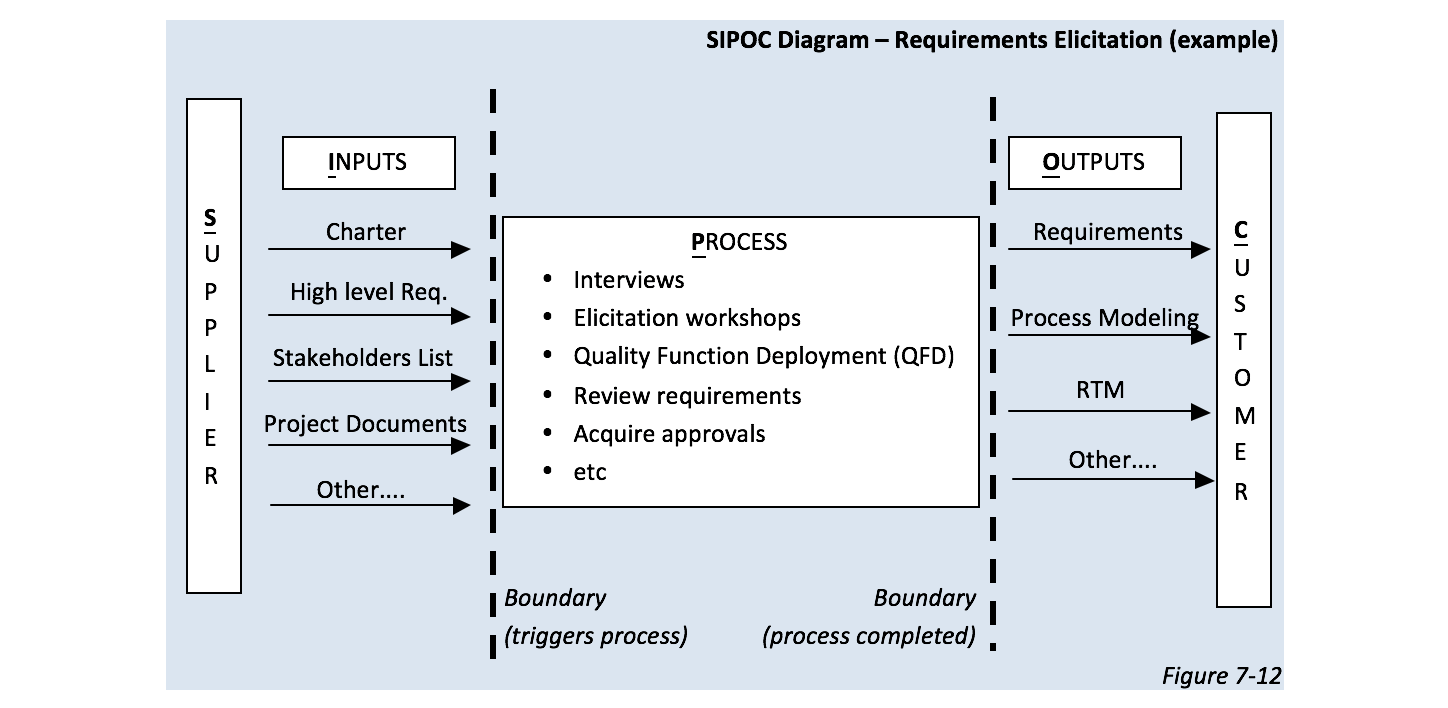 Image from the
"3D Business Analyst" book.
Image from the
"3D Business Analyst" book.
In this example, suppliers are: domain experts, stakeholders, technical team, testing team and end user because they supply the BA with information used to create the outputs. To identify customers, ask yourself who has interest in your deliverables. Development team will use your requirements to code the system, testing team will create test cases using your documents, business owners and domain experts need to approve your documents. There you go, you just defined your process, what you need to start, what is expected from you by whom and who supplies you with your needs.
A SIPOC can be created in any order; however, it is recommended to identify the Process, followed by Customer, Outputs, Inputs, and then suppliers.
3.2. Measure (where are we now?) top
The work you have done in the Define stage is to understand the process required to improve its performance and identify the customer goals. In the Measure stage you need to clarify things by investigating how and how well the work gets done. The purpose is to establish the current performance level (baseline) and collect data about the process to be analyzed in the next stage. Tools and tasks performed in the Measure stage:
- Walk the process
- Collect baseline data
- Create current state map (read more in part 1)
- Identify problems and opportunities
- Other statistical tools
3.3. Analyze (understand why problems occur) top
Now that you know what is happening in your process, it is time to find out why and identify
the potential root causes of the problem, which you will work on resolving and improving in the
next stage.
Root-cause analysis (Fish-bone diagram) and 5 Whys technique are the most common tools used
to push the team beyond symptoms to uncover potential root causes.
Both Measure and Analyze stages involve a good amount of advanced tools that require more
in-depth knowledge of statistical principles which will not be covered in this article, as this is
an introduction to Lean Six Sigma. However, here are the common tools used to measure and
analyze the process performance for your further readings. You can read more about these tools
in the Six Sigma Vocabulary section:
- Measurement System Analysis
- System Capabilities Cр & Cрк
- Regression Analysis
- Failure Modes & Effects Analysis (FMEA)
- Control Charts
- Hypothesis Testing
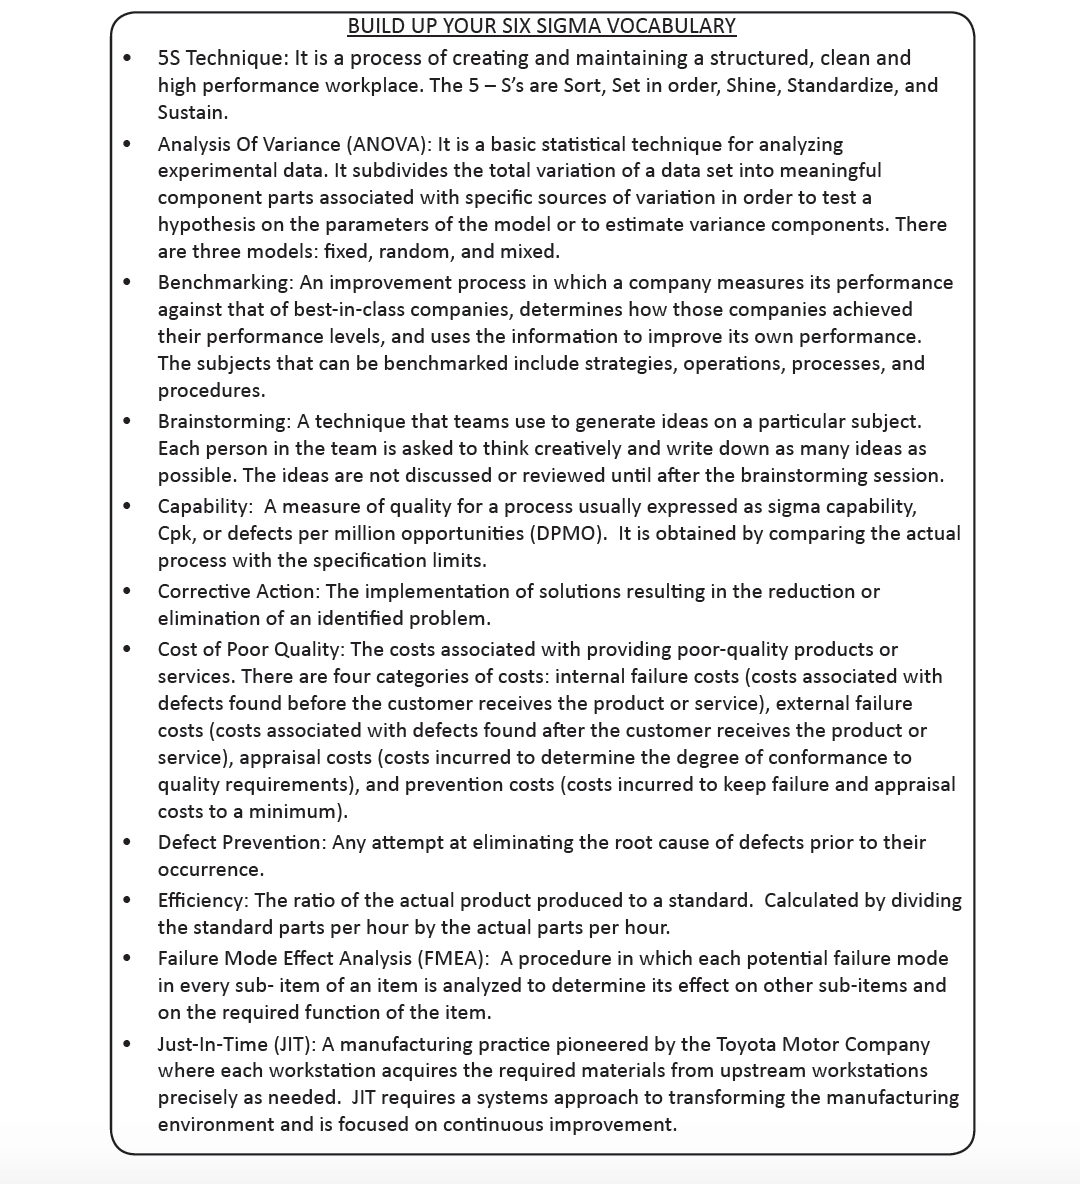
- 5S Technique – see the 6σ vocabulary section
- Theory Of Constraints (TOC)
- Analysis Of Variance (ANOVA)
- Time Value Analysis
3.4. Improve (Solve problems) top
At this point, you have defined your customers and their goals/problems, measured your process to understand its current state, and performed further analysis on the system to identify the root causes of the process problems. Now it is time to brainstorm with the team to come up with some ideas to address the root causes, select the best ones and implement them to improve the process.
Tools and tasks performed in the Improve stage:- Develop the ideal state map (Lean & Six Sigma integration)
- Use Lean principles (FLOW & PULL) to eliminate waste (Lean & Six Sigma integration)
- Brainstorm improvement ideas
- Prioritize and select improvement ideas by using PICK Chart
- Develop Future State Maps (Lean & Six Sigma integration)
- Design Of Experiments (DOE)
After brainstorming is completed, you will have a lot of improvement ideas (could be hundreds) that need to be evaluated. PICK Chart is a great tool to evaluate and prioritize ideas in order to select the best improvement solutions to apply to your process.
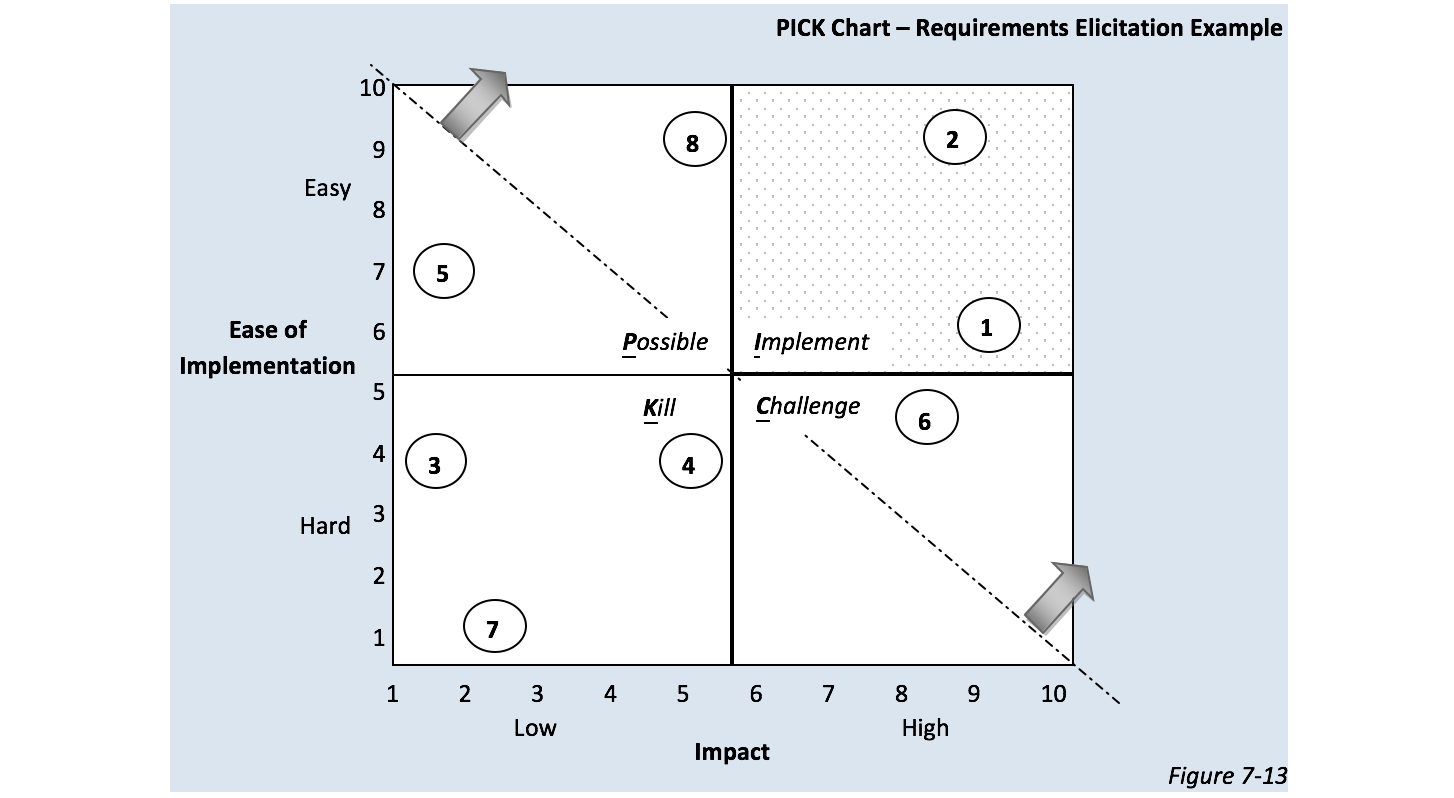 Image from the
"3D Business Analyst" book.
Image from the
"3D Business Analyst" book.
PICK is an acronym for Possible – Implement – Challenge – Kill. Draw the PICK Chart and add ideas to it based on how easy they are to implement and their impact to improve the process. Start implementing ideas that fall in the implement box (shaded) then ideas that are above the dotted line. Ideas that fall in the Kill box are killed and not considered because they are hard to implement with low impact on the process. Let’s see how to use the PICK Chart on the “requirements elicitation” example.
Let’s assume you have the following ideas to improve the current state map for the “requirements elicitation” example:
- Relocate the Lead BA to work onsite
- Reassign tasks between Lead BA, BA1 and BA2
- Hire an additional PM
- Hire an additional BA
- Train BA’s on requirements elicitation
- Re-structure the workplace to make team members more reachable to each other based on their communication needs
- Purchase more advanced computers
- Apply PULL principle to reduce communication with SME’s (BA’s pull information from team members only when needed)
Now put the ideas on the PICK Chart as in the figure above. Start with implementing ideas 1 and 2 then
8 and 6. Ideas 3, 4, 5 and 7 should be killed because they are hard to implement and have very low
impact.
After implementing selected ideas, develop future state maps for the process. Then design a set of structured tests to measure and assess the effect of these changes on
the process. This is called Design Of Experiments.
Design Of Experiments (DOE) is a systematic approach to investigate a process. It is a more advanced technique than the classical experiments that tends to change only one factor at a time and hold everything else constant (impossible to do in a complicated process). DOE can focus on a wide range of key input factors or variables, making the DOE process economical and less interruptive.
3.5. Control (sustain achievements) top
In this stage you need to control the process to make sure to sustain what you have achieved in process improvements. Putting a control plan in place is crucial to ensure that the process is carried out consistently and it does not go back to its initial state before improvements. Also controlling the process will result in early detection of any defects that could occur later on.
Tools and tasks performed in the Control stage:
- Measurement System Analysis (MSA): it is the process of validating and calibrating the measurement system for its accuracy, sensitivity and precision
- Control Chart: it is a time plot chart showing process performance, mean (average) and control limits. It is used to determine if the process is in control (within control limits) or not
- Communication Plan
- Target Progress Report
- Sustainment Plan
- Transitioning the project to the customer and closing it